

Price with participation
Footprint, delta and cumulative delta, aligned with the chart.
Order flow, market structure and replay.
One focused workspace for index futures.
From the shape of a session to the trades inside a candle.
Bring price, volume and participation into the same view.
Footprint, delta and cumulative delta, aligned with the chart.
Volume profiles, reference levels and zones across the session.
Historical replay and simulation to study how a move unfolded.
Native windows, synchronized navigation and multiple timeframes.
Study illustrations · Sample data
Keep the important areas on your chart. Combine session references with supply, demand and fair value gaps as price moves between them.
Illustrative session
Return to a historical session and watch it develop again. Slow it down, step through the tape and practise before putting capital at risk.
Interactive demonstration · Sample data
A rising candle only tells part of the story. Use delta and cumulative delta to understand how buying and selling activity changes behind it.
Illustrative session
Keep the evidence around a signal in view. Built-in studies bring price action, participation and market structure together on the same chart.
Illustrative session · Decision-support tools
Keep the bigger picture close and the detail closer.
Arrange your charts, synchronize their navigation and move between timeframes.
Give each chart its own space. Build a layout around the instruments and timeframes you follow.
Synchronized navigation helps you compare the same moment across your charts without searching for it again.
Choose your studies, adjust their appearance and keep the information that matters to your process.
DeepAlpha Sentinel brings market updates and chart snapshots to Telegram, so you can review the context without keeping the workspace in front of you.
Get early access Sentinel availability will be confirmed at launch. DEEPALPHA SENTINEL
Review the latest chart context.
Your studies. Your levels. Ready to explore.
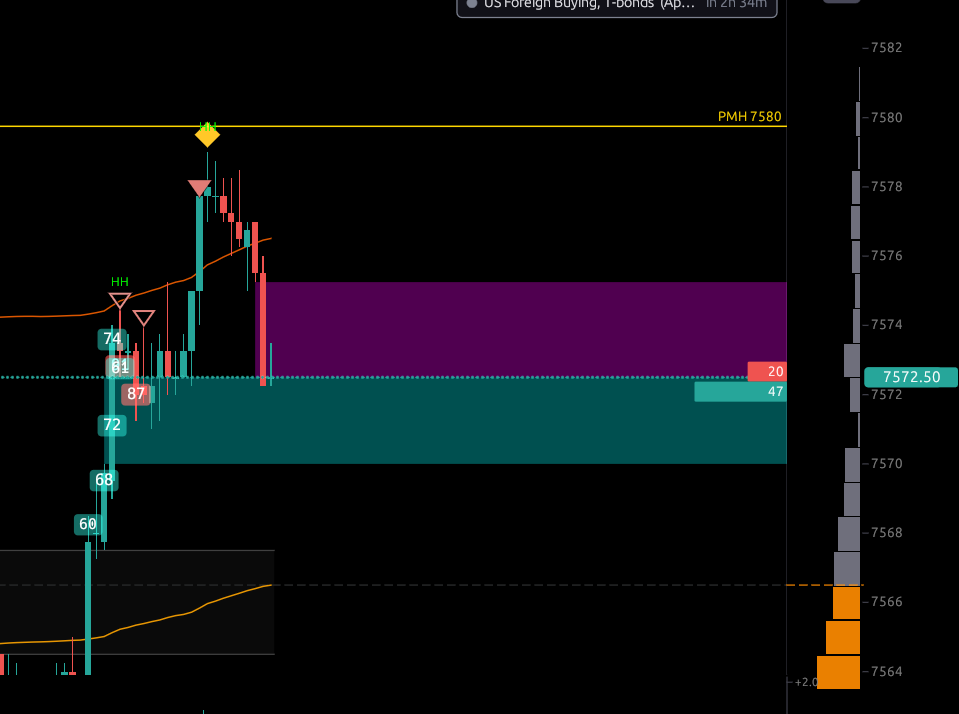
Illustrative notification · Actual DeepAlpha chart
A clearer picture before you join.
DeepAlpha is a native desktop charting platform for index futures. It brings footprint, volume profiles, delta, cumulative delta, market structure, replay and decision-support studies into one workspace.
The current application focuses on Nasdaq and S&P 500 index futures, including NQ, MNQ, ES and MES. Chart timeframes range from one minute to daily.
DeepAlpha is currently in private testing. Join the early-access list to receive availability and launch updates. Joining the list does not create a paid subscription or guarantee immediate access.
DeepAlpha is a native desktop application. The current application runs on Windows; platform availability and setup requirements will be confirmed before public access.
The application includes historical replay and a trading simulator for working through entries, stops, targets and trade reviews. These tools let you practise with historical data without presenting simulated results as live trading performance.
No. DeepAlpha's studies and signals provide context for your own analysis and decisions. They do not guarantee profits. Trading futures involves risk, and historical or simulated outcomes do not predict future results.
Public pricing, access terms and market-data arrangements have not been announced. Details will be shared before public access so you can review the complete requirements.
Currently in private testing
Get the first look at DeepAlpha.
Join the list for early-access and launch updates.
No payment required. Read our .